Our methodology keeps people front and centre – from requirements gathering to rapid prototyping to continuous improvement – so you get broad adoption.

Business Intelligence
& Data Visualisation.
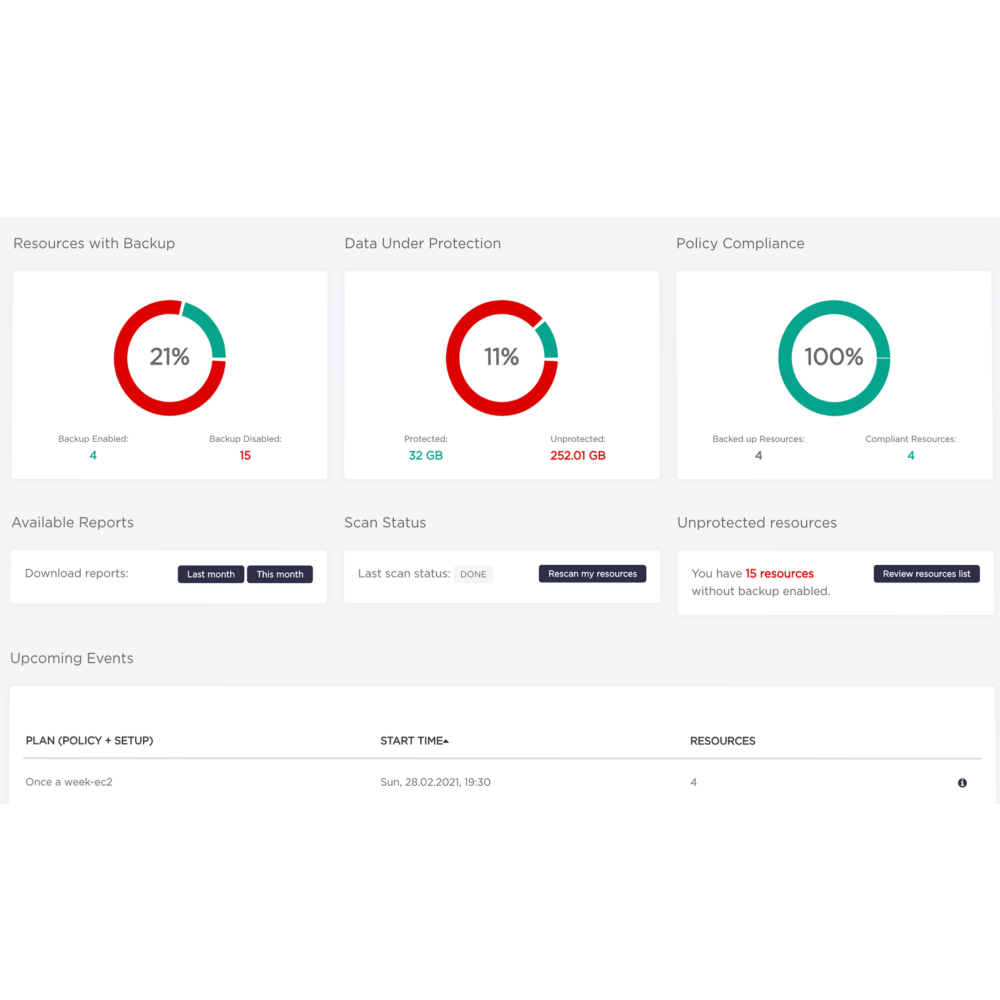
Say goodbye to confusing and opaque reporting. Get actionable insights into your organisation's data using high-quality, user-friendly dashboards.
Get in Touch Every report tells a story: Make sure it’s a good one.
People’s eyes light up when they first see Nordcloud-designed BI dashboards – because they finally have easy access to the insight they’re looking for.
Even the most comprehensive dashboard won’t drive business value if people don’t (or can’t) use it. Our proprietary approach to BI dashboard delivery ensures the best possible user experience – and delivers maximum value to the people seeking insight from data. We drive user adoption by properly identifying key user groups and analysing their needs and ways of working. Then, we use rapid prototyping tools that allow for quick and cost-effective feedback and iteration.
That way, reports aren’t just visually appealing – they’re tailored to your users’ and customers’ needs, workflows and even their data literacy. And that means they’re delivering the value people need.
Content Hub.
Want to become the next cloud ninja? Welcome to the go-to online hub for tech leaders who want the latest insights on all things cloud.
Learn more
Why Nordcloud?
User-centred BI
We make data beautiful
It’s all about getting people to say: “Wow! The reports are so easy to use and understand!” Which also means they’re excited about using the tool.
Efficient and value-driven
We’re laser focused on value, eliminating waste and rework and seeking constant improvement through feedback and iteration.

Human-centred and adoption-driven dashboards.
A robust methodology with comprehensive data UX expertise
Our data UX services include solution envisioning workshops, design system development, user adoption research and recommendations, dashboard usability audits as well as UX and data visualisation training.
Data Visualisation Centre of Excellence.
Get best practices, leadership, support and training in everything around visual analytics and reporting
We help you facilitate and create a flexible operating model for BI reporting delivery across your organisation. We create efficiency and agility for your development teams and drive consumer-level UX for your users.

Customising and extending BI tools.
When your needs go beyond your BI platform’s out-of-the-box functionality, we’re here to help
We’ll create stunning interactive custom data visualisations and build custom data connectors. And we’ll enable your customers and users to access rich, interactive dashboards and visualisations from within your website or app, with embedded analytics.

User enablement and training.
Upskill your teams and take the reins of your analytics workspace
Enrol in group workshops, where we tackle complete subjects and dissect them with real-world examples and use cases. We also offer dedicated 1:1 sessions where your team members get personalised training from our senior experts.

Ericsson.
Case Study
Nordcloud supported Ericsson in building a cloud-native blockchain solution and transforming product delivery.


Get in Touch.
Let’s discuss how we can help with your cloud journey. Our experts are standing by to talk about your migration, modernisation, development and skills challenges.

Risto Jäntti
Global Data GtM Lead