
Simple Monitoring Solution On Microsoft Azure
This article was inspired by a project in which our customer wanted to have monitoring for his Azure environment and didn’t want to invest into a 3rd party monitoring solution. Instead, they wanted something available with the platform.
As you know, there are many monitoring solutions out there on the market, both free and paid. Cloud Platform providers also offer their own monitoring solutions. Their advantages may be:
- Good integration with Cloud Platform services
- Automated deployment or standardised metrics, for example, Microsoft Azure has their Azure Monitor.
This short article gives you an idea how you could build a monitoring solution with Azure Monitor.
How to start?
To get started with Azure Monitor, you need an Azure subscription and Monitoring Contributor role. People with this role can view all monitoring data, and create and modify monitoring settings within the subscription.
Next, you need to think about which services/resources you want to monitor. PaaS and SaaS services usually come with platform metrics available out of the box. Just use them, create alert rules and that’s it.
IaaS services, like virtual machines, also come with platform metrics. And if you’d like to have deeper insights into OS performance data, disk space or system logs, here is where Azure Monitor Agent (AMA) and guest-level metrics become handy.
Where to start?
I’m not a fan of how Microsoft was previously approaching monitoring in Azure. Look at the following screenshot of a VM monitoring tab:
Enabling some of these components involves installing separate agents on the VM. Sometimes, they are sending redundant data to the same or different locations. This is okay until you really need that. Usually, having all these components enabled is not necessary and brings additional costs and management overhead.
Fortunately, nowadays Azure Monitor is about to cover most of them.
According to Microsoft, Azure Monitoring Agent (AMA) will replace other agents soon. I prefer to open Azure Monitor and do any configurations there.
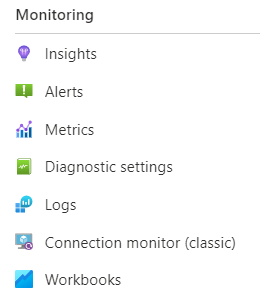
So, go to Azure portal ( https://portal.azure.com ) and search for Azure Monitor.
Azure Monitor
Azure Monitor is an umbrella for everything monitoring related platforms can offer. It has capabilities for collecting cloud platform, applications and services telemetry data, enabling analysing them and acting by triggering alerts and sending notifications. Azure Monitor aggregates metrics from platform services as well as application and OS logs with the help of Log Analytics integration.
Here is an Azure Monitor solution high-level diagram:
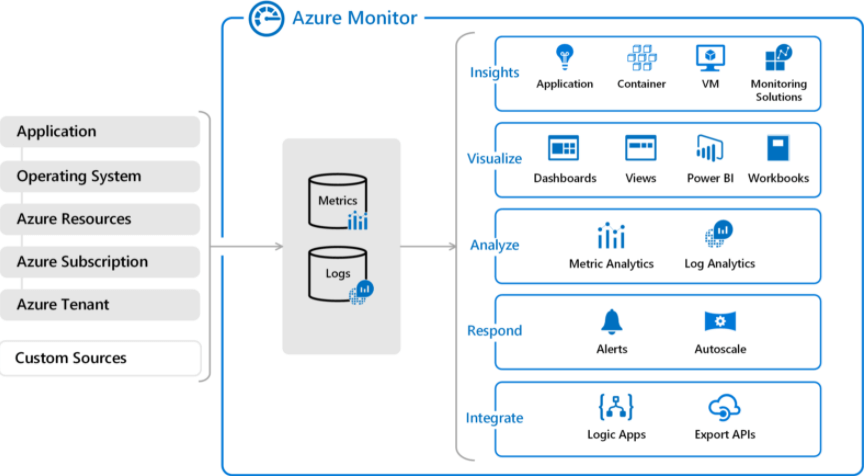
At first glance, Azure Monitor may seem overwhelming. This is because it’s ready to satisfy many of your needs, but you may not need them all. To start successfully monitoring your environment, you need metrics, logs and alert rules only. Let’s start breaking things into smaller pieces…
Building blocks
- Azure Monitor: Available out of the box and if you are happy with standard platform metrics, just add alert rules with notifications like email
- Log Analytics Workspace: This is an optional component. It’s useful if you’d like to collect OS performance data, disk space or system/application logs
- Data Collection Rule (DCR): A component of Azure Monitor used to link VMs to Log Analytics Workspace and to define data sources to be collected by Azure Monitoring Agent (AMA). When VM is added to DCR, AMA gets installed automatically.
- Azure Policies: This is an optional component. It’s useful when the number of items to monitor grows. Using policies automates the whole process of setting up monitoring for resources as well as guarantees they are compliant.
Log Analytics Workspace + Azure Monitor DCR (Data Collection Rules) + Azure Policies = powerful tools for building a monitoring solution at scale
Monitoring Virtual Machines
Virtual machines have standard platform metrics which are collected automatically while collecting OS performance data. System or application logs require the Azure Monitor Agent (AMA) to be deployed to each monitored VM.
Start with creating a Log Analytics workspace and then go to Azure Monitor and create DCR. Configuring DCR means pointing out which data sources to collect from which resources and to which Log Analytics Workspace to send them. Adding VM to DCR triggers AMA installation automatically.
You can automate to handle this process at a scale with VM tags and Azure policies. To keep things simple, we will not touch deploying policies in this article.
Monitoring other services
As already said in the beginning, PaaS and SaaS services usually come with platform metrics available out of the box. Utilise them by creating alert rules.
Alerts
Alert rules are created based on metrics or queries on data gathered in the Log Analytics workspace. Adding actions to alert rules makes your monitoring solution capable of e.g. sending notifications or executing scripts when triggered.
In this table, I gathered few examples of alerts and thresholds which trigger them:
| Alert name | Threshold | Action Group |
|---|---|---|
| CPU-critical-alert | >= 90% | critical-alert-ag |
| RAM-warning-alert | <= 15% | warning-alert-ag |
| RAM-critical-alert | <= 5% | critical-alert-ag |
| disk-warning-alert | <= 15% | warning-alert-ag |
| disk-critical-alert | <= 5% | critical-alert-ag |
| Backup -failed job alert | >= 1 failed backup job | warning-alert-ag |
| VPN-critical-alert | >=1 | critical-alert-ag |
Here is a warning alert query example for low disk space on Windows OS. This query will provide results for any number of disks you have in your system, including disks added in time:
Perf
  | where ObjectName == "LogicalDisk" and CounterName == "% Free Space"
  | where InstanceName !contains "_Total"
  | where InstanceName !contains "HarddiskVolume"
  | where CounterValue > 5
  | summarize AggregatedValue = min(CounterValue) by bin(TimeGenerated, 15m), Computer, InstanceName
And here is the alert logic. It defines the threshold, time range to query and how often the above query will be run:
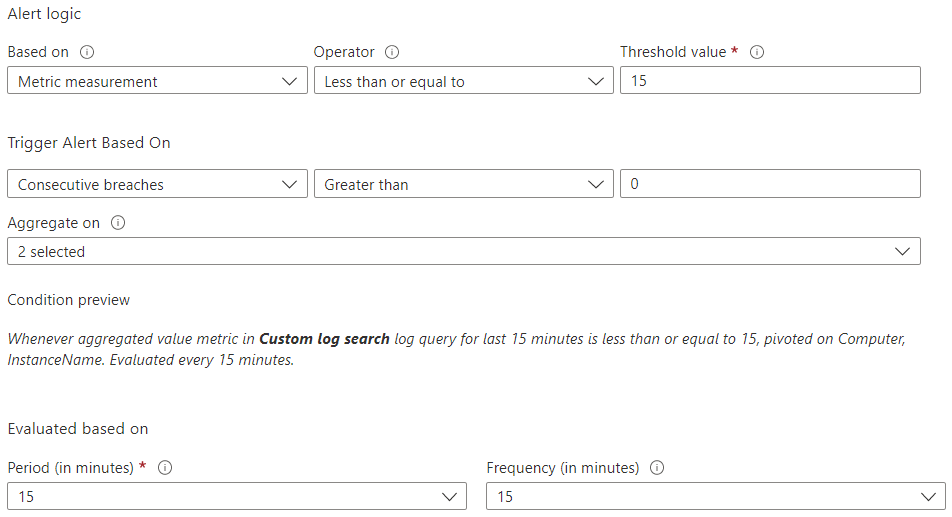
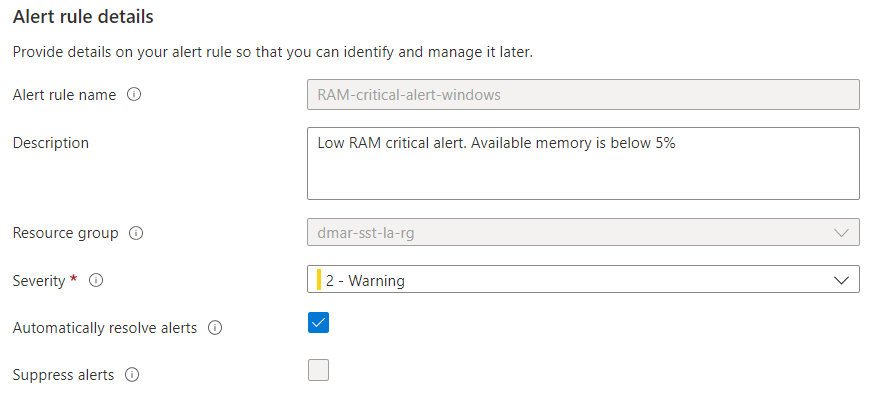
There is one very useful alert feature called “Automatically resolve alerts”. What does it do? It tells Azure Monitor to not send repetitive alert messages until the alert failure condition is resolved. Enable it for query-based alerts when your query runs repetitively. This way you will prevent monitoring solutions from sending repetitive alerts for the same failed resource.
Costs
And finally, how much will it cost? It depends on how much data you collect, keep and process. Azure Monitor is not free, but it includes free units which for small projects may be enough to keep costs low.
Summary
In this short article we’ve touched a bit on monitoring with Azure Monitor. This knowledge should help you to get started.
You can explore more about Microsoft Docs at this link: https://docs.microsoft.com/en-us/azure/azure-monitor/overview

Get in Touch.
Let’s discuss how we can help with your cloud journey. Our experts are standing by to talk about your migration, modernisation, development and skills challenges.
